Predicting what is likely to happen in the future is now something we can do with greater accuracy, made possible thanks to recent advancements in AI and Deep Learning.
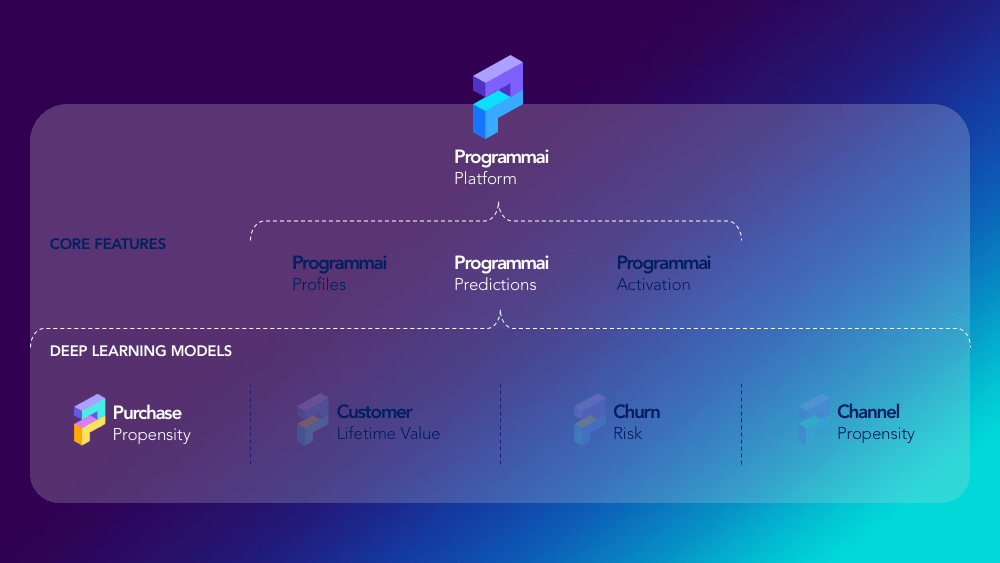
The second Core Feature of our Platform is therefore aptly named, Predictions.
Each model distils vastly complex interactions in your data into an actionable score. We then find it useful to work with customers divided into predictive groups of 10 or deciles.
Let’s begin with our first model, Purchase Propensity.
Taking as many sales and as much revenue as possible every day is undoubtedly an objective all Retailers are aligned to.
As a Marketer, where should you place your bets?
Not all behaviours are of equal importance or relevance per consumer, we’ve shown that in the last chapter. If you’re fortunate you might have a huge number of consumers pass through your website and a large customer database interacting in complex ways with your offering. Advertising to them all is costly and the likelihood of purchase varies by consumer. It’s therefore wise to reflect this in the urgency for advertising when making such decisions.
Let’s sink a little deeper here; what is your stake and how do you calculate risk?
The total consumers available to advertise to will carry an expected revenue and profit value to your business, should they indeed purchase. Instead of setting an arbitrary budget, what if we spread a weighted amount across these consumers to reflect their individual need for advertising, and potential to generate incremental return.
I’ll simulate a scenario to illustrate one example:
Jonathan has an expected revenue of £200 and a Purchase Propensity score of 20%
Laura has an expected revenue of £100 and a Purchase Propensity score of 60%
If we only had £20 to spend, assuming a profit margin of 50%, we might traditionally spend this on Laura and pocket £80 (£30 profit) should she purchase. Your traditional performance metrics would look good:
80 ROAS and 20 CPA
Taking a different approach we might try:
[Expected Profit x Purchase Propensity x %Spend]
In our example, this would allocate £8 to Jonathan and £12 to Laura in an attempt to convert both consumers. These ads stand to increase both Jonathan and Laura’s propensity to purchase, whilst maintaining a calculated level of risk.
If we convert both, we’d pocket £300 (£130 profit) and our performance metrics would soar:
280 ROAS and 20 CPA
Even if you miss out on a purchase from a consumer with Laura’s high propensity, the upside available should you nudge Jonathan to purchase more than covers your loss:
180 ROAS and 20 CPA (£90 profit)
This outcome is still superior by a factor of 3x.
Investing purely in Laura is fine, but the incremental return is finite. Investing in Jonathan in the hope that he becomes tomorrow’s Laura can be done in a risk averse way to increase the overall incremental return. If we care about our consumers we could add value to Jonathan’s overall experience too, as opposed to aggressively marketing to all of our Lauras!

This model gives you ultimate control by ranking consumers by their Purchase Propensity and allows you to play with the window it projects forward. For example, you may wish to sort consumers by most likely to purchase today, or in the next 7 days, and so forth.
We know that by introducing these predictive scores you can take your strategies up a level or two while doing right by the consumer, here’s just one example of a client using our model to double ROAS and reduce CPA by a quarter in a bid to be more efficient.

Personally, all Retailers ought to be experimenting with efficiency and incrementality.
Coming up next, the Customer Lifetime Value model.
Stay tuned.


